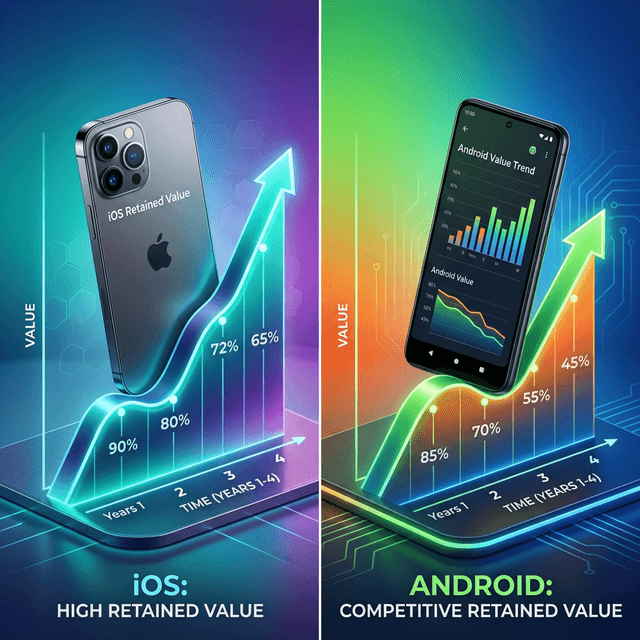
The Depreciation Curve
A smartphone is like a car; it loses value the second you take it out of the box. But not all phones depreciate at the same rate. If you belong to the crowd that upgrades their phone every 1-2 years, understanding resale value is crucial to minimizing your total cost of ownership.
The Apple Advantage: Why iPhones Rule Resale
The data is clear: iPhones retain their value significantly better than Androids.
On average, an iPhone loses about 16% to 20% of its value in the first year. In contrast, an average flagship Android phone can lose anywhere from 33% to 45% of its value in the same timeframe.
Why Does This Happen?
- Long-term Software Support: Apple provides 5-6 years of iOS updates. A 4-year-old iPhone still feels relevant because it runs the latest software. Many Androids stop getting updates after 2-3 years.
- Brand Perception & Demand: The aspirational value of the Apple logo creates massive demand in the second-hand market. High demand with limited supply keeps prices high.
- Slower Release Cycles: Apple releases one main lineup a year. Brands like Samsung or Xiaomi flood the market with dozens of models, rapidly making their own older models obsolete.
Are Androids Still Worth It?
Yes, absolutely! The rapid depreciation of Androids is actually great news for second-hand buyers. You can pick up a 1-year-old flagship Android for half its original retail price, offering incredible value for money compared to buying a new mid-range phone.
Check Market Value Instantly
Curious about what your current phone is worth? Browse the listings on Handovr to see real-time market prices for verified devices in your city.